Cyclic population dynamics of Arctic lemmings
Arctic lemmings show dramatic fluctuations in their population dynamics. Some years densities can be very high followed by a sharp decline and crash in numbers. These changes in numbers are also known to follow a cyclic pattern with three to four years between peak years. This phenomenon is well known and has been attracting the attention of scientists for a century. Several hypotheses have been put forward to explain this cyclic pattern.
The cyclic dynamics in lemming numbers is also of interest in Arctic ecosystems where lemmings seem to play a key role. The same cyclic pattern can be seen for many birds of prey and mammalian carnivores. Furthermore, the breeding success of Arctic waders and ducks has also been shown to follow lemming cyclicity with a one year time lag. Predators preying on lemmings take advantage of their high densities during peak years but have to switch to alternative prey during years of low lemming density, thereby forcing other prey species in to the basic lemming cycle.
Over some geographical areas, lemming numbers have been in synchrony, i.e. populations have reached a peak the same year. If climatic effects are strong, synchrony should be expected to span over large areas, whereas if predation or dispersal has strong effects, synchrony should be expected on a smaller geographical scale, and only to a lesser extent between islands. Therefore, the degree of synchrony is important when analysing different populations.
The aim of the project
The overriding aim of the project is to test the predictions of current hypotheses that attempt to explain the causes of the cyclic dynamics. This will be done in collaboration with other scientists in Theme A “Tundra Northwest – interactions between plants, herbivores and predators” examining foraging and the social behaviour of lemmings, past fluctuations of microtines (analysis of scars on willow stems), plant lemming interactions and lemming-predator interactions. Several questions are involved: the synchrony/asynchrony of the cyclic dynamics of Arctic microtines, population density in relation to productivity and latitude, the relationship to predators, to plants and to other herbivores.
Methods
Information on the present density of each microtine population was obtained using a standardized snap-trapping programme. At each site 10 lines were set out, each with 20 stations and three traps at each station, i.e. 600 traps. The traps were set out for 24 hours and were checked three times. In addition snap-traps were set out at selected places, i.e. favourite places with lemming burrows and runways. Also, a live-trapping grid was worked out at most sites: 50 longworth traps in a grid 10×10 m. These traps were checked frequently, generally every three hours. We made notes on habitat type and vegetation on the trap line and the grid. Information on earlier lemming densities was obtained from signs of lemming activity (frequency of faeces and winter nests). We also took a number of digital photos from the helicopter for habitat analysis.
Captured animals were brought to the lab where their body length and weight were measured. Their eye-lenses were removed and preserved for future analyses, (weight of dried eye-lenses will be used for age determination and examination of the age structure of each population) Their reproductive condition was examined by counting the number of embryos and the placental scars of females. The testes size of males was also measured.
Results
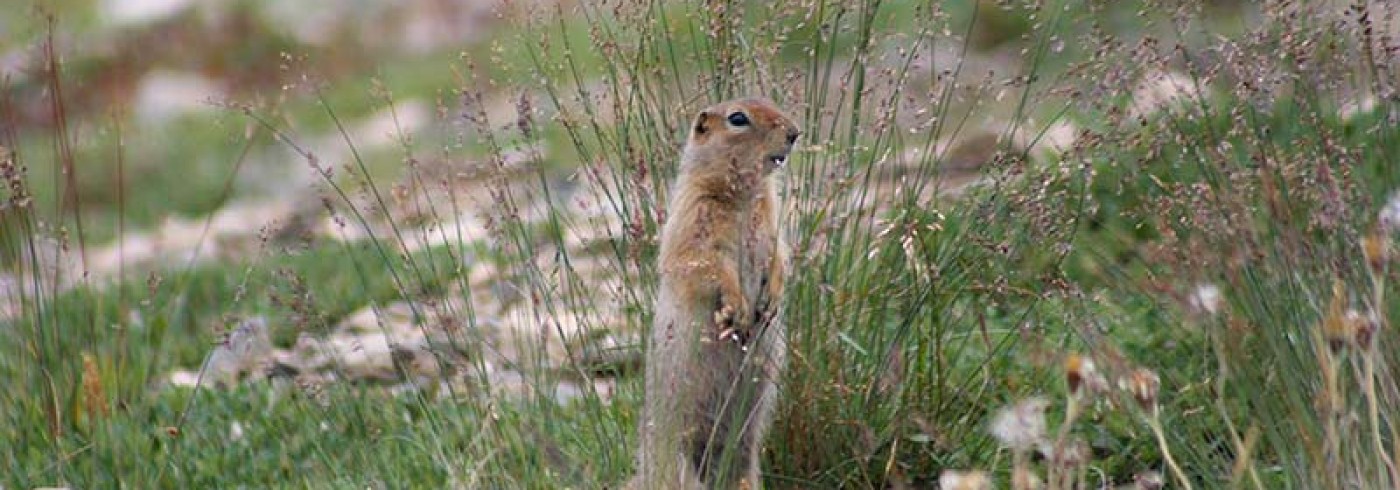
Altogether 233 small mammals were captured on the expedition, 231 microtines and 2 shrews (table 1). The most frequently occurring species was the Greenland collared lemming (Dicrostonyx groenlandicus). It occurred at all sites where we managed to catch any small mammal. At most sites (11 out of 15) the collared lemming was the only microtine caught. Brown lemming (Lemmus trimucronatus) was among the captures from three sites and the tundra vole (Microtus oeconomus) from two sites. The Alaska vole (Microtus miurus) and the tundra redback vole (Clethrionomys rutilus) were found at site 11 (Ivvavik National Park), the westernmost site close to Alaska. This site showed the highest diversity of small mammals (six species) found during the expedition.

Microtines and shrews captured at various sites du ring the Tundra Northwest 1999 expedition.
D = Dircostonyx groenlandicus, Greenland and collared lemming; L = Lemmus trimucronatus, brown lemming; Mo = Microtus oeconomus, tundra vole; Mm = Microtus Miurus, Alaska vole; C = Clethtionomys rutilus, tundra redback vole; S = Sorex cinereus, masked shrew.
Density is the number of captured individuals per 100 traps set out for 24 hours
Apart from site 4 (Bathurst Island South) and site 9 (Banks Island) the collared lemming occurred in extremely low densities. The brown lemming also occurred in low densities. Obviously the lemmings generally were in the low phase of the lemming cycle. At two sites (4 and 9), the densities of collared lemming were a little higher. These populations were close to the low phase, either in early increase or in late decline. The two sites differed greatly in general performance. On Banks Island (site 9) the ground was covered with vegetation, mainly heath vegetation. Wollaston Peninsula (site 7) also had heath vegetation that covered about 50% of the area. On Bathurst (site 4) on the other hand only patches between rocky and stony areas were covered with heath vegetation. This site obviously had very low productivity.
On two western mainland sites (site 8 and 10) tundra voles were in high densities. These populations were obviously in increase towards the peak phase of the microtine cycle. A close demographic analysis will be performed later and the results will be examined in ca-operation with other projects connected with lemming cyclicity.
Dates
1 July–31 August 1999
Participants
Principal investigator
Anders Angerbjörn
Department of Zoology, Stockholm University
Sweden
Principal investigator
Sam Erlinge
Department of Ecology, Lund University
Sweden
Alice Kenney
Department of Zoology, University of British Columbia
Vancouver, Canada
Charles J. Krebs
Department of Zoology, University of British Columbia
Vancouver, Canada
Mikael Svensson
Department of Ecology, Lund University
Sweden