Evolutionary consequences of the Pleistocene glacial cycles
11 July 2005 - 11 August 2005
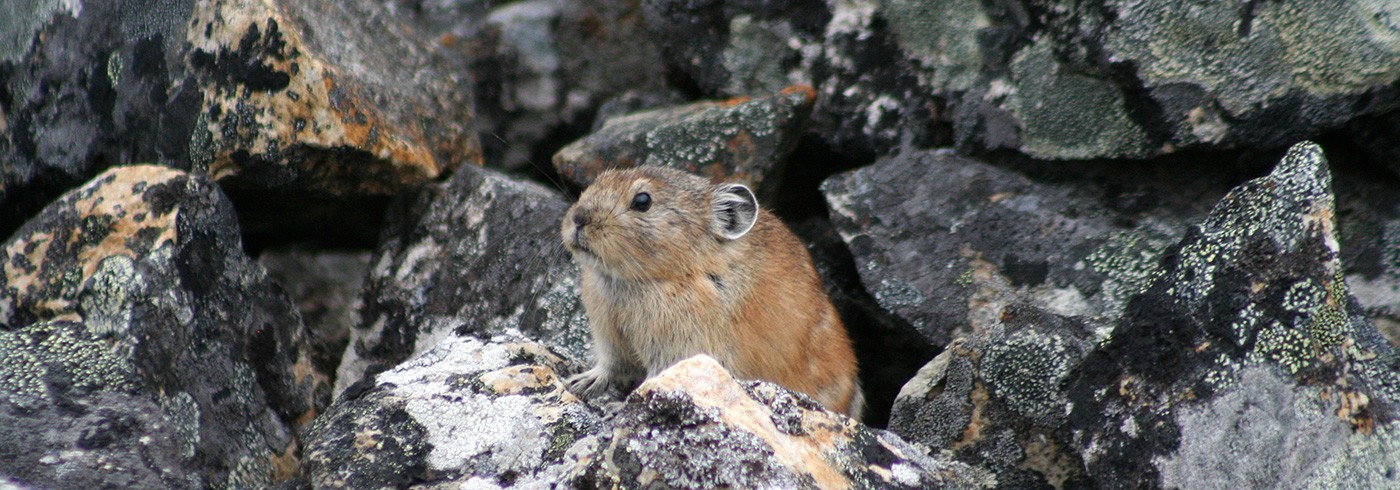
A pika, Ochotona hyberborea. Photo: Love Dalén
Scientific background
Species with sympatric geographical distributions can be expected to interact with each other in a number of ways, for example through competition, parasitism or predation. This may lead to the evolution of behavioural or morphological traits which can either facilitate or counteract these interactions. However such co-evolution also requires that the species are temporally co-distributed.
Pleistocene climatic fluctuations are acknowledged to have had a huge impact on the spatial distribution of species. Several phylogeographic studies have shown that these distributional changes have led to distinctive patterns in the species’ current genetic structure (Hewitt, 2000). Although it was previously thought that entire communities of species shifted their ranges in concert (e.g. Mengel, 1964), recent genetic studies have suggested the opposite, namely that changes in species’ distributions due to climatic fluctuations have occurred independently of each other (Taberlet et al. 1998, but see Sullivan et al., 2000). The vast majority of these studies have however been done on temperate species (e.g. Taberlet and Bouvet 1994, Santucci et al., 1998), while only a few have investigated Arctic species (e.g. Fedorov and Stenseth 2001, 2002). Thus an independent response may not necessarily be the dominant pattern in Arctic species. One evolutionary consequence of an independent response to climatic fluctuations is that there would have been little opportunity for long-term co-evolution between species, whereas a concerted response would favour long-term co-evolution (Sullivan et al., 2000). Specialist predators and their prey could therefore possibly be predicted to have had a concerted response. On the other hand, a high degree of concerted response in arctic species would predict a higher degree of generalism in parasites, since a long-term co-distribution of potential host species would favour a high degree of interspecific transmission.

An arctic ground squirrel, Spermophilus paryii. Photo: Love Dalén
In this project we attempt to address two specific questions:
- Which factors affect the spatial and temporal distribution of arctic species?
- What are the evolutionary consequences of concerted vs. independent responses?
With lemmings in focus, we have several specialist predators preying on this species, e.g. the arctic fox and the snowy owl (Angerbjörn et al. 1999, Wiklund et al., 1999). On the other hand there are several other species which have more of a generalist predator response to lemmings, e.g. the red fox. The same varying relationships can be found in the relationship between ptarmigan and their predators, with especially the gyrfalcon being a specialist predator (Nyström et al., 2005). Similar relationships can also be found for lemmings and their parasites, where some are specialists, e.g. hantavirus can still switch between different rodent hosts (Vapalahti et al., 1999).
Our aim was therefore to compare the phylogenetic relationship between small rodents and their predators and parasites. However, we were also interested in the population dynamics at each site, since this can influence the presence of both predators and parasites.
Fieldwork
Our intention was to collect tissue, blood, faecal samples and intestines from several predator and prey species at a number of places throughout Beringia. Faecal samples would be used to collect DNA from the defecator. Trapping/capture of small rodents would allow sampling of both prey and parasite DNA. Samples were also to be taken from dead specimens, hair and faecal samples. Furthermore nests and dens of the concerned predators would be used to collect DNA samples from their prey. For trapping of small rodents we had two parallel setups with one systematic set of trap lines and another set of opportunistic traps. The systematic trap lines can also be used for estimates of abundance.
The fieldwork took place at 14 sites in Beringia. Four sites were visited in the Anadyr region, 5 sites in northern Chukotka including Wrangel Island and 5 sites in Alaska. The sampling was also coordinated with colleagues in Kamchatka.
Results
All together we managed to obtain a substantial set of data with more than 500 samples, including about 200 from voles (mostly Microtus oeconomus) and 100 from bears (faecal droppings from mostly Ursus arctos, but also a few from U. maritimus) (table 1). For the small mammals we dissected the animals so we have frozen tissue for analyses of DNA and parasites. In some cases we will also search for bacteria and viruses.

Number of specimens sampled for different mammal and bird groups.
We found fairly high densities of Microtus oeconomus in Chukotka (table 2). However the density varied between habitats, as shown in Penkigney Bay at two different sites (table 2). At Kolyushin Bay this had dropped to a very low number, indicating that there is no strong synchrony in the population phase of Microtus oeconomus in Chukotka. On Wrangel Island there was an early increase of lemming abundance. At one site about 20 km from the coast we trapped no animals at all, but at the coast close to the research base we found an abundance of both Lemmus and Dicrostonyx, suggesting an early increase phase of the population cycle. Here we got splendid help from a muskoxen scientist, Alexander Gzuzdev, and his dog Art. They managed to increase our sample size quite considerably. Alexander walked on the tundra and looked for fresh signs of lemmings, for example under rusty barrels. When he found some signs he called on the dog and gently lifted the barrel where the dog quickly sneaked in, took the lemming and handed it over to Alexander.
In the Anadyr area, the dominating species was Clethrionomys rutilus (n=32) but we also trapped one C. rufocanus, 2 Sorex sp., 5 Microtus oeconomus and 4 Lemmus trimucronatus.

Density of small rodents (number trapped per 100 trap nights) on six sites in Chukotka and Alaska.