Air-earth-current observations to study solar wind effects on the global electric circuit
1 November 2003 - 1 December 2003
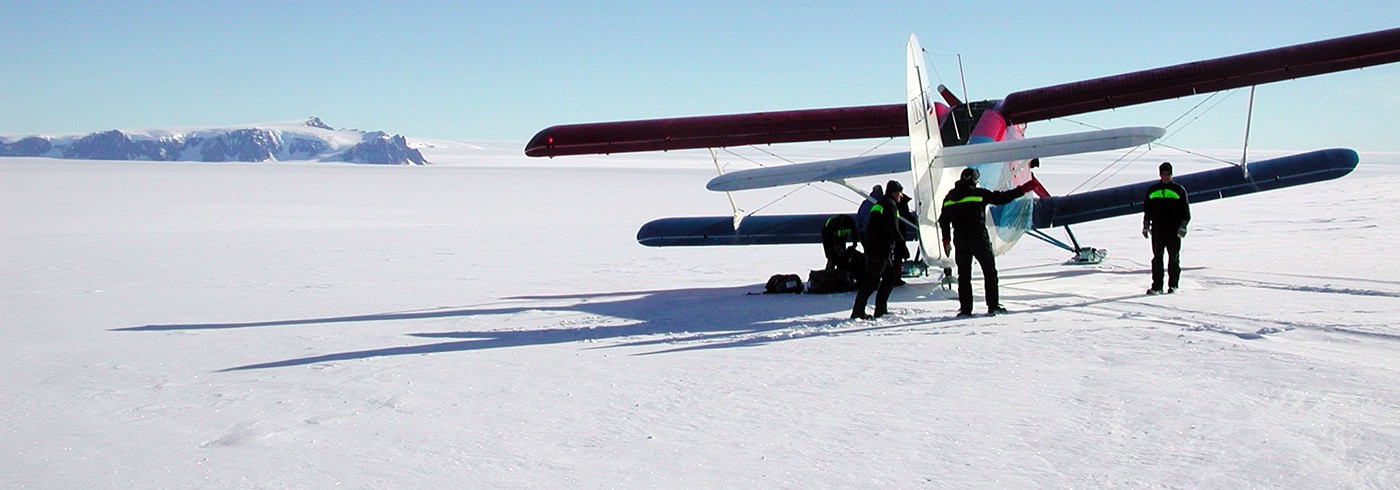
Arriving at Wasa station. Photo: Sheila Kirkwood
Scientific background
The aim of this project is to quantify the effect of disturbances on the Sun on the global atmospheric electrical circuit. In this circuit the accumulated effect of thousands of thunderstorms, mostly in the tropical regions of the Earth, feeds a weak electric current from the ground up to the electrically conducting ionosphere, above an altitude of about 70 km. The current spreads out around the globe through the ionosphere and returns to Earth through the atmosphere as the ”fair weather current” outside the thunderstorm areas (also known as the air-earth-current). Although the existence of the global electric circuit has been known for many decades, there are still many gaps in our knowledge concerning, for example, the contribution of other electric field generators. These include the action of the solar wind (ions and electrons flowing out from the Sun) and tidal wind systems in the Earth’s upper atmosphere, between altitudes of about 50 km and 200 km. Since disturbances on the Sun directly modify the solar wind and atmospheric ride generators, as well as the atmospheric conductivity (through cosmic rays) there is a potential for solar activity-driven changes in the global electric circuit. The nature and amplitude of any such effects is so far poorly researched.
It has further been suggested that changes in the global electric circuit due to disturbances on the Sun might have an effect on clouds and on weather at the Earth ’s surface. Bot h the observational evidence and the theoretical basis for proposing such a link are so far highly controversial. Quantifying the effect of solar disturbances directly in the electrical parameters at the surface can help to test whether a weather link is a reasonable hypothesis or not.

View of Wasa station from below. The long wire antenna which collects the air-earth-current runs down the slope immediately below the station. Photo: Sheila Kirkwood
The parameter of the global electric circuit that is simplest to measure is the electrical current reaching the Earth at high latitudes, far away from thunderstorms and local sources of electrical pollution. Since 1998 continuous observations of this ”air-earth-current” have been made in Kiruna in the Arctic (67.89°N, 21.09°E). Measurements have also been made at the Swedish Antarctic station Wasa during austral summer expeditions in 2002 and 2003. Combining simultaneous measurements from both sites is an extremely powerful way to discriminate true disturbances of the global electrical circuit from local disturbances such as wind-generated electrical disturbances or local electromagnetic induction effects. Unfortunately the kinds of disturbance that we want to study are rare, so short summer campaigns do not give many chances to capture suitable events. The observations made at Wasa during 2002 and 2003 and earlier results are described in more detail in Swedish Polar Research Secretariat’s yearbook for 2003. In order to try to obtain more observations it was decided to install equipment which could continue to record data during the austral winter, and this was done in November 2003.
Field measurements at Wasa November 2003-February 2004
Equipment to measure air-earth current was re-installed at Wasa station (73.03°S, 13.25°W) on 12 November 2003. A new low-power electrometer amplifier and a new data logger system with lithium battery power was put into use, calculated to be able to operate continuously and to store the data for a little more than 2 years. The system worked well up to the time that the expedition left WASA on 2 December 2003. Unfortunately a storm damaged an ancillary instrument (pyranometer) on 5 December, which disrupted the data logging. This system was put back into operation (without the pyranometer) by the following expedition in January 2004 and the system was left operating from 4 February 2004.

Checking the data from the air-earth-current measurements. Photo: Sheila Kirkwood
Preliminary results
There were many days with little wind during the expedition. This allows the baseline to be established, i.e. the daily variation of the air-earth current due to the thunderstorm source. This is shown by the heavy black line in the figure, with the dashed lines indicating the standard devia tion. The well -known maximum during the UT afternoon hours is clearly seen (this is due to daytime thunderstorms over Africa and South America). The largest solar disturbance to affect the Earth during November 2003 was a major geomagnetic storm with a sudden commencement at 0802 UT on 20 November. The weather at Wasa was very windy on 19 November and in the afternoon of 20 November, but there was a relative lull in the morning of the 20th. The air-earth current on this day (pink magenta in the figure) does nor not show any distinct effect – if the sudden commencement has any effect, it is less than the normal daily variation.

Shows the measurements of air-earth-current at the Antarctic station Wasa during November 2003. The thick black line and the black dotted lines show the average and standard deviation over the 8 quietest days (least wind) in the measurement period. Here the daily variation in the current (from about 0.5 to 0.7 nA) due to the daily variation of tropical thunderstorm activity can be seen. The data plotted in pink is the measurement on 20 November, just before and just alter the sudden commencement of a major geomagnetic storm (ssc-marked by the vertical line). No significant signature of the ssc can be seen.