Aerosol dry deposition velocity measured at Wasa, Dronning Maud Land, Antarctica
Wet and dry deposition are the ultimate paths by which trace gases and particles are removed from the atmosphere. Dry deposition is the transport of species, in gaseous or particulate form, from the atmosphere to surfaces without help from precipitation or cloud droplets. Factors that govern dry deposition of a gaseous species or a particle are the level of atmospheric turbulence, the chemical properties of the species being deposited, and the nature of the surface itself.
The atmosphere and ecosystems are linked via vertical fluxes of momentum, sensible and latent heat, and fluxes of atmospheric constituents. Knowledge of these fluxes is needed, for example, in predicting future states of the atmosphere. Through aerosol deposits and atmospheric gases captured in air bubbles, ice and snow profiles from the Antarctic continent provide a natural archive of atmospheric composition. This archive is important for our understanding of past climate and its variations. How to interpret these data is, however, not always straightforward. An improved understanding of the deposition processes of aerosols will make interpretation easier.
The aim of this project is to characterise dry deposition over the ground in Antarctica in relation to surface roughness height, boundary layer structure and the dominant size range of aerosol particle size distribution. An eddy-covariance system has been used for this. The eddy-covariance method offers a way to measure the turbulent transport (vertical flux) of a compound by correlating the fast fluctuations of its concentrations with the vertical wind speed. The project is a subproject of the EPICA programme (European Project for Ice Coring in Antarctica).
Instrumentation and method
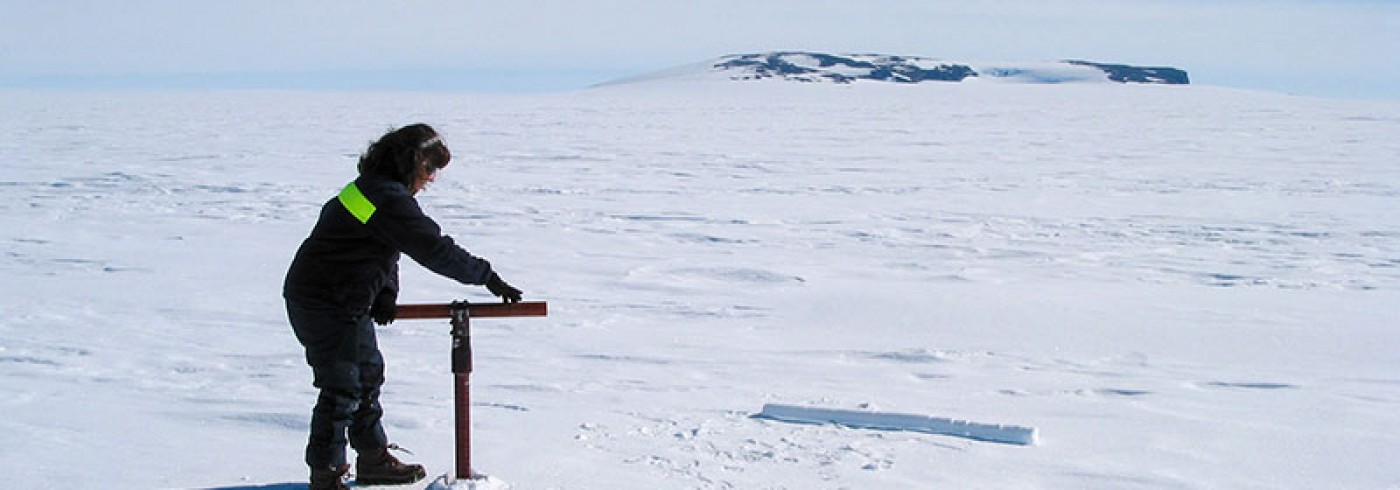
The measurements obtained during the fieldwork were made with an eddy covariance system. The eddy covariance system included a condensation particle counter which measured aerosol particle number concentration (N) for diameters (Dp) >lO nanometer at l Hz. The vertical wind component (w) was sampled at 20.8 Hz with an ultrasonic anemometer, which also measures horizontal wind components and temperature. The vertical aerosol number particle flux was calculated from the turbulent fluctuations of N’ and w’. The dry deposition velocity, vd, was derived from the vertical aerosol flux, normalised with the aerosol number concentration. The eddy covariance system was located on the nunatak Basen, 300 meters upwind from the Swedish Antarctic station, Wasa (73°03′ S, 13°25′ W). The anemometer was mounted at the top of a 5-meter-high mast, while the condensation particle counter was located at the foot of the mast with its sampling intake located just below the anemometer. Measurements were made in January 2000, during the Austral summer.
Observations
Statistics on flux calculations shows that the flux, , has a bias towards negative values, which means that most of the time the flux was directed towards the ground, suggesting that deposition to the surface was dominant over any other sources. However, a significant peak of positive particle fluxes were also observed, indicating a particle source at the surface. This source is possibly the resuspension of particles from the ground. The main result derived from the flux measurements is particle dry deposition velocity. Typically, the deposition velocity is dependent on turbulence intensity, atmospheric stability and aerosol particle size.
Dates
November 1999–February 2000
Participants
Principal investigator
Margareta Hansson*
Department of Meteorology, Stockholm University
Sweden
Anna Grönlund
Department of Meteorology, Stockholm University
Sweden
Douglas Nilsson
Department of Meteorology, Stockholm University
Sweden
*Not participating in the expedition

